WHAT IS CULFIDANT INVESTMENT SUCCESS INDEX or CIS Index© ?
“Culfidant investment success index, or CIS Index ©” is a quick-and-dirty way to evaluate the risk and reward of an investment. Here is how it works.
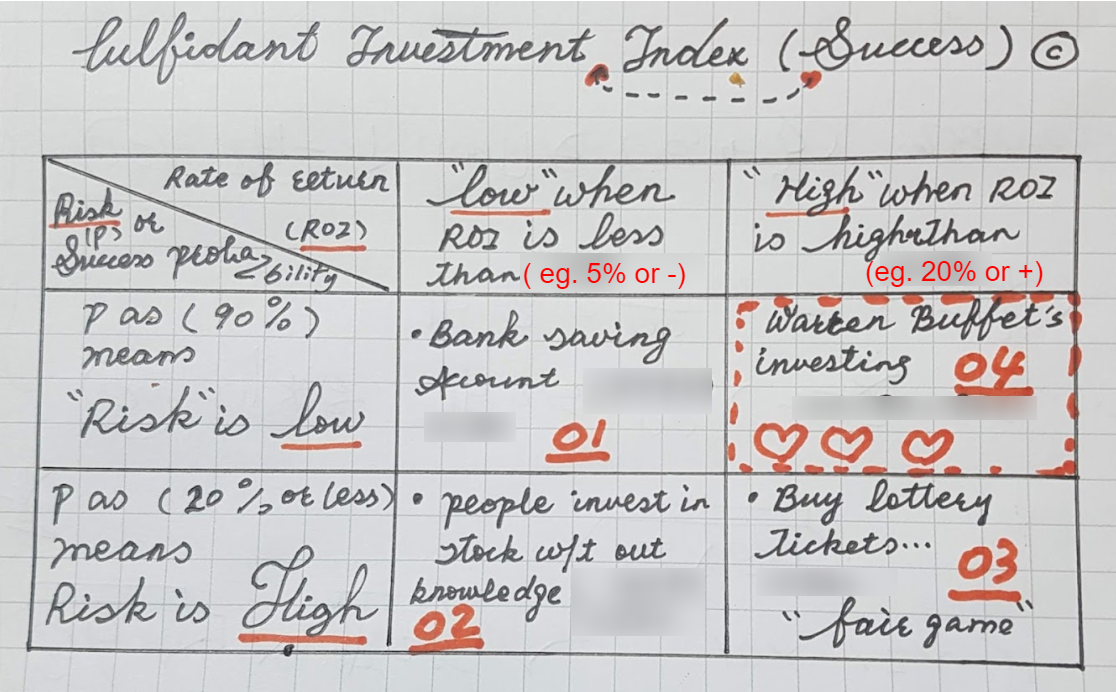
“Culfidant investment success index©” is defined as the result of using the rate of success probability (to reflect the risk level) to multiply the rate of return (ROI). It is a rule of thumb to evaluate the combination of the risk and reward of an investment effectively and quickly. We are going to use a few examples below to explain how it works.
A FEW EXAMPLES TO SHOW HOW TO USE THE INDEX
01 – “Low-return, low-risk” example – Let’s use the common bank saving account, which is used by many as a way of saving money. The interest or, the rate of return annually of 2% is a fair bet, and the risk of not getting this rate of return is fairly low, or the “success probability” should be as high as 90 to 100%. Therefore, “the Culfidant investment success index” for this particular “investment” is
180~200 = 90~100% of P * 2% of ROI (after having all the % symbol removed to make it into an Index figure that is easy to read and compare)
in other words, the Index for this so called “low return, low risk” investment is around 180 to 200. Which is not very exciting at all.
One thing you may find very quickly is that many mediocre low risk and low return investments are having similar CIS index figures in the lower-hundred range, which is a good indication that you may not get much out of it after all.
02 – Low-return and high-risk example –
Let’s consider someone who is investing into the stock market “blindly” – he might be fancied by the great performance of Warren Buffet of 40% ROI compounded over 30+ years, and feel himself could do at least 10% ROI annually compounded.
However, in reality, many are actually doing very well over the years if they are not losing money, and the probability of such “decent” performance of 10% ROI is also quite low (say around 10% or less) due to his lack of knowledge and expertise in the stock investment. Therefore, his investment in stock may be predicted by the following CIS index
100 = 10% (P)*10% *(ROI)
Again, the CIS index is at the lower-hundred range (200 or so, may be lower)
03 – High-Return and High-risk example –
A perfect example I can think of, is to buy lottery tickets. You may wonder, wait a minute, Is buying a lottery ticket a low risk and high return? After all, for a small fortune of few bucks, you could make millions if you win, how could this is a “high- risk” ?
Fair question. Actually this is likely the biggest misconception lures many people into this win-lottery-ticket frenzy, while the government is making millions out of this lottery industry. And here is why.
The fact you can afford to lose a few bucks is actually not the same thing as the “low risk” in this particular lottery buying activity. The risk in any investment is defined as the probability (chance) for an investor to hit the target of the investment. In the lotter-ticket case, what is the the chance (or in mathematics term, probability) for one to hit the jackpot and win multi-million prize? It is one out of 20-million, for a 20-million lottery. Let’s say the cost of one ticket is $20. Use the formula of CIS index, you will get the following
CIS index =500 = 0.05*100*100 = 1/20-million (P)*100 % * 20-million/20 (ROI)*100%
As you may see, CIS index of 500.00 is still in the bulk park of mid hundred range and marginally similar with the above first two examples.
Furthermore, what really brings down the overall CIS index is exactly the extremely low probability of success, or in other words, the extremely high, not low risk.
04. Low-risk and high-return example
Let’s use Warren Buffett, the legend of stock investing, as an example to demonstrate what is so called low-risk and high-return investment.
In the last half century, Warren has achieved (meaning his success probability is 100%) the compounded ROI of 40% annually. It means,
CIS Index = 100 (P) * 40 (ROI) = 4,000
Based on our experience, any investment project with a low CSI index that is in the middle to low range of hundreds, such as 500 or less, is likely a poor one (it is normally one of, or the combination of three types of so called Low-risk & low-return, High-risk & low-return, or high-risk & high-return).
In contrary, Higher CSI index of 3,000 or more indicates a healthy and promising investment. It is normally in the category called “Low-risk & High-return”.
EVALUATION ON 3-OPTIONS OF FINDING TENANTS USING CIS INDEX
Now let’s use CIS index to evaluate the 3-options to find A+ tenants, there are
Option 01 – Traditional DIY by landlord self
Option 02 – Using Conventional Property Management Service
Option 03 – Using CARMAP service
To keep it simple, we use an rental with a market rent of $1500.00 as an example, and our goal is to find A+ tenants who will stay for 5 years (or longer). This means the fulfillment of so called undercurrent cash flow click and see [01] of $3000.00 per year, or $12,000 for 5-yr period.
For the first option, the chance (success probability) to find such A+ tenant to stay for 5 years is not quite high on average, or P is 10% or less.
What about the cost? Although it seems no cost on surface, as all the work are done by the landlord as DIY, on average around 150 hrs may spent to find such tenant, if we use $40.00 /hr to estimate the time spent into the dollar value, the total cost will be $6000.00, the ROI, compounded in 5 years should be around 15.00 % annually.
CIS Index = 10% (P) * 15% = 150.00
For the option 2, the chance (success probability) for a property manger to find A+ tenant might be marginal higher than DIY, say 20%.
In the meantime, you may spend 10% of rents as the PM fee, or a total of $9,000.00 for a property manager to work for you instead of yourself in 5 years. The ROI compounded annually for the 5 years is around 6%.
CIS index = 20% (p)*6% (ROI) = 120.00
Now let’s see option 03 – Carmap service. It has been approved based on our own 50,000+ cases, and conservatively speaking, 90 out 100 times we have A+ tenants stays over 5 years or longer, which give the P as 90% or 90.
The total cost of using CARMAP is $2,300.00 ($1,800 plus $500 set up fee if this is your first time) that will guarantee you 5 years. therefore, the compounded ROI annually is ~40%
CIS index = 90 (p) * 40 (ROI) = 3600.00
As you may see, the Option 1 and 2 are having CIS index of 120 to 150 respectively, versus the option 3 has the CIS of 3600 or, more than 20 times better than either option 1 or 2.
It is no brainer which option is going to bring you the homerun you need for your real estate investment success.